Stock Investment Details
Mastering Market Returns: The Ultimate Guide to Using Our Online Stock Calculator
Investing in the stock market is one of the most reliable ways to build wealth over time, but understanding the true performance of your portfolio involves more than just glancing at the current share price. Whether you are a seasoned day trader or a beginner looking to park savings in an S&P 500 calculator, knowing your exact numbers is crucial. This is where a high-quality stock calculator becomes your most valuable asset.
Too many investors guess their returns. They forget about the corrosive effect of inflation, the compounding magic of dividends, or the subtle drag of trading commissions. A comprehensive stock calculator eliminates this guesswork, providing a crystal-clear picture of your financial standing. By inputting specific data points, you can transform abstract percentages into concrete dollar amounts, allowing for smarter, data-driven decisions.
In this guide, we will walk you through every feature of our tool. We will explore how to input your trade details, why dividend adjustments matter, and how to interpret the advanced metrics that often confuse casual investors. Whether you are analyzing a single tech stock or using this as a proxy index fund calculator, you will learn exactly how to leverage this tool for maximum financial clarity.
Understanding the Purpose of a Stock Calculator
Before diving into the fields and figures, it is important to understand what problem this tool solves. At its core, a stock calculator is a simulation and analysis engine. It bridges the gap between your initial capital and your future financial goals.
For the modern investor, the market is noisy. Prices fluctuate, dividends arrive on different schedules, and inflation silently erodes purchasing power. A standard spreadsheet can be prone to human error, and doing the math on the back of a napkin is impossible when you factor in compound interest and variable timeframes. This tool is designed for anyone who wants precision—from the retiree living off dividends to the aggressive growth investor.
This tool acts as a specialized investment growth calculator. It takes the raw data of your trade—what you bought, when, and for how much—and processes it to show you the “real” story. It answers the questions that matter: Did I actually make money after inflation? How much of my gain came from dividends versus stock price appreciation? By answering these questions, the stock calculator empowers you to refine your strategy moving forward.
Step 1: Entering Stock Investment Details
The first section of the tool focuses on the fundamental identity of your trade. Precision here is key, as even a small error in the number of shares or dates can drastically skew the final output of any stock gain calculator.
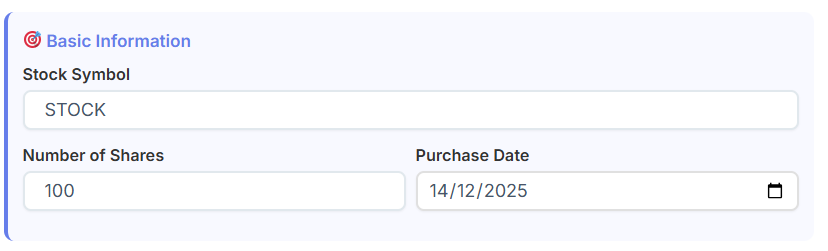
The Stock Symbol
Entering the stock symbol (e.g., AAPL, TSLA, or SPY) helps you categorize your analysis. While the calculator processes the numbers you input manually, associating those numbers with a specific ticker helps you organize your records, especially if you plan to export the data later. It grounds the calculation in reality.
Number of Shares
This is the multiplier for every other metric in the stock calculator. If you bought 50 shares, every dollar of price movement affects your equity by $50. It is important to input the exact number of shares you currently hold or plan to buy. For those practicing fractional investing—common with expensive stocks—ensure you enter the decimal precisely (e.g., 5.4 shares).
Purchase Date
Why does the date matter? In the world of finance, time is money. The purchase date context is essential for calculating annualized returns. A 10% return over one month is phenomenal; a 10% return over ten years is poor. By establishing a start date, the tool can later determine your Compound Annual Growth Rate (CAGR), functioning effectively as a compound return calculator. This helps you benchmark your performance against market averages.
Step 2: Defining Purchase & Sale Price
The core of any profit calculation lies in the difference between your entry and exit points. However, a robust stock calculator goes beyond simple subtraction.
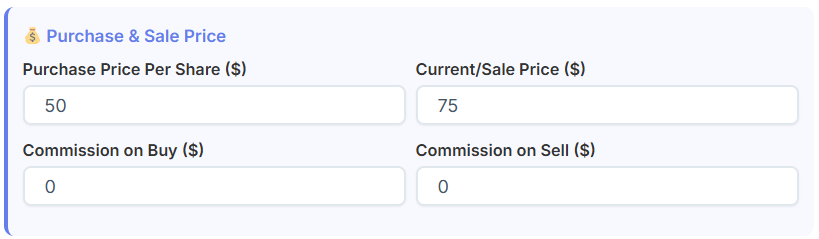
Buy Price vs. Sell Price
You will enter the price per share at the moment of purchase and the price at the moment of sale (or current price if you are still holding).
- Buy Price: This establishes your cost basis.
- Sell Price: This determines your revenue.
The gap between these two figures is your capital gain (or loss). However, novice investors often overlook the “cost of doing business.”
The Impact of Commissions
In the age of “free” trading apps, many forget that commissions still exist, especially for over-the-counter stocks, foreign exchanges, or specific brokerage tiers. Our tool includes fields for both Buy Commission and Sell Commission.
Think of commissions like business expenses. If you run a company, you need to price your products high enough to cover your overhead. In the same vein, smart investors use tools like a Pricing Calculator to understand how costs eat into margins. Similarly, in stock trading, if you make a $50 profit but paid $20 in commissions to enter and exit the trade, your real profit is significantly lower. Entering these fees ensures the stock calculator gives you a net result, not a gross result.
Step 3: The Power of Dividend Information
One of the most powerful wealth-building engines in the market is the dividend. Ignoring dividends is a common mistake that leads to underestimating total returns. This section allows the tool to function as a sophisticated dividend analyzer.
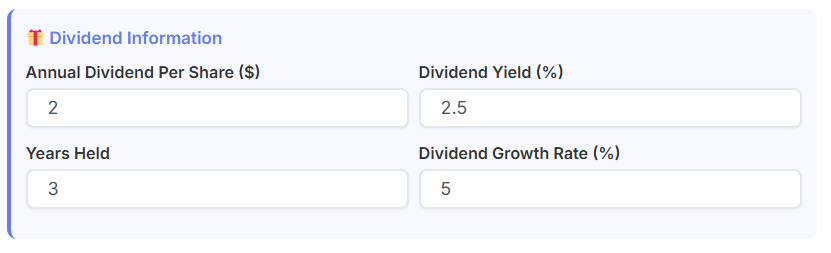
Annual Dividend Per Share
Here, you input how much the company pays out annually for each share you own. If a company pays $2.00 per share per year and you own 100 shares, that is $200 of passive income.
Dividend Yield
The yield is the dividend expressed as a percentage of the stock price. This helps you compare the income potential of different stocks. A high yield might look attractive, but it is essential to look at the health of the company paying it. Just as a business owner tracks liquidity using a Cash Flow Calculator, you need to ensure the company has the cash flow to sustain those dividends.
Years Held
This input is critical for the compounding calculation. The longer you hold a dividend-paying stock, the more significant the impact of reinvestment becomes. This field allows the stock calculator to project the accumulation of payments over time.
Dividend Growth Rate
Companies often increase their dividends annually. If you ignore dividend growth, you are underestimating your future wealth. A stock that raises its payout by 5% every year will provide a massive yield on cost after a decade. Inputting a growth rate transforms this from a static snapshot into a dynamic forecast.
Long-Term Compounding
When you combine these inputs, you see the “snowball effect.” This is where the tool shines as a compound return calculator. It shows you that your return isn’t just about the stock price going up; it’s about the cash the company pays you while you wait.
Step 4: Configuring Additional Metrics
To get a truly professional analysis, you must look beyond the raw trade data. This section allows you to factor in economic context and valuation metrics.
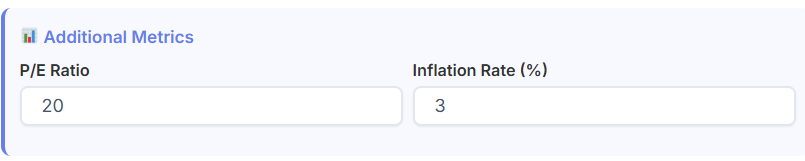
P/E Ratio (Price-to-Earnings)
The P/E ratio helps you understand if you are overpaying for a stock. While the calculator doesn’t “solve” the P/E for you, inputting it helps you contextualize the result. A high P/E implies high growth expectations. Understanding the fundamentals of a company is similar to calculating a customer’s long-term worth. You might use a Customer Lifetime Value calculator to gauge the long-term value of a client relationship; similarly, the P/E ratio helps you gauge the long-term value of the company’s earnings relative to its price.
Inflation Rate
This is perhaps the most sobering field in the stock calculator. Inflation is the silent thief of wealth. If your stock goes up 5% in a year, but inflation is 6%, you have technically lost purchasing power.
By entering the current inflation rate, the tool calculates your “Real Return.” This distinguishes a nominal gain (the dollar number) from a real gain (what those dollars can actually buy). This feature is essential for long-term planning, making it a vital component for anyone using this as a retirement or investment growth calculator.
Step 5: The Calculate Button
Once you have meticulously filled out the sections—header details, investment specifics, pricing, dividends, and metrics—you are ready to click “Calculate.”
This action triggers the engine of the stock calculator. Instantly, the tool processes the interplay between your entry price, commissions, holding period, dividend accumulation, and inflation. The speed of this calculation is vital. It allows you to run “what-if” scenarios. What if I held for 5 more years? What if the dividend growth rate was 2% lower? What if inflation spikes to 4%?
Immediate feedback allows for iterative planning. You aren’t just calculating one outcome; you are stress-testing your investment thesis.
Analyzing Results & Outputs
After the calculation runs, you are presented with a detailed breakdown. Understanding each of these outputs is critical to interpreting your financial success.
Total Return
This is the headline number. It combines capital gains (price increase) and total dividends received. It answers the simple question: “How much money did I make in total?”
Return Percentage
This expresses your total return relative to your initial investment. It is the standard metric for comparing different investments. A 20% return on a small stock trade might be better than a 5% return on a large bond investment, depending on your goals.
Annualized Return
This is often the most important number for serious investors. It smooths out your return over the number of years you held the stock. If you made 50% total return, that sounds great. But if it took 10 years to get there, your annualized return is quite low. This metric allows you to compare your specific stock pick against a benchmark, like an s&p 500 calculator result, to see if you are beating the market average per year.
Capital Gain
This isolates the profit made strictly from the price change. It ignores dividends. This is useful for tax purposes, as capital gains are often taxed differently than dividend income.
Total Dividends
This sums up every penny of cash payment you received during the holding period. For income-focused investors, this number is more important than the capital gain.
Initial Investment vs. Current Value
- Initial Investment: The total cash you put up (Shares × Buy Price + Buy Commission).
- Current Value: What your holding is worth now (Shares × Sell Price).
Seeing these two numbers side-by-side provides a stark reality check on your portfolio’s growth.
Real Return (Inflation Adjusted)
As mentioned earlier, this is your purchase power increase. If the stock calculator shows a positive nominal return but a negative Real Return, you know that your investment strategy needs to become more aggressive to outpace the economy.
Total Commissions
This sums up your buy and sell fees. Seeing this number in black and white can be shocking for active traders. It reinforces the importance of using low-cost brokerages.
Visualizing Success: The Table & Chart Section
Numbers are essential, but humans are visual creatures. The Results section includes dynamic tables and charts that bring the data to life.
The Breakdown Table
The table provides a year-by-year (or month-by-month, depending on the view) ledger of your investment. It shows the progressive growth of your balance. You can trace exactly when your dividends started to snowball or when a specific price jump elevated your portfolio. This tabular data is excellent for those who like to audit the path of their wealth.
The Charts
The charts visualize three key components:
- Capital Gains: Represented usually as a growth line or bar, showing the stock price trajectory.
- Dividends: Often stacked on top, showing how income supplements price growth.
- Total Return Curve: The aggregate line that inevitably moves faster than the price line due to the compounding effect.
These visuals help you intuitively grasp concepts like exponential growth. When you see the curve steepen in later years, you visually understand why patience is the most critical skill in investing. It validates the output of the compound return calculator logic embedded in the tool.
The Value of the PDF Download Feature
At the bottom of the results page, you will find a “Download PDF” option. This is not just a convenience; it is a tool for professional record-keeping.
Why Export?
- Tax Preparation: You can hand these reports to your accountant to verify trade dates and cost bases.
- Investment Journaling: Successful investors keep a journal of their trades to analyze their psychology and performance. Attaching a PDF report from a stock calculator to your journal provides hard data to back up your reflections.
- Client Reporting: If you manage money for family or friends (informally), providing a clean, professional PDF report helps communicate performance transparently.
- Strategy Comparison: You can run five different scenarios for the same stock, download the PDFs, and compare them side-by-side physically to make a final decision.
Why This Tool is Essential for Every Investor
The difference between gambling and investing is data. A gambler hopes for a good result; an investor calculates the probability of a good result. By using a reliable stock calculator, you move from the first camp to the second.
For the Beginner
If you are just starting, this tool teaches you the mechanics of the market. By playing with the “Dividend Growth Rate” or “Years Held” inputs, you learn lessons that no textbook can teach as effectively. You see firsthand how small contributions, compounded over time, turn into massive sums. It demystifies the stock market.
For the Experienced Trader
For the veteran, this tool is about efficiency and precision. It saves time on manual calculations and provides a quick “sanity check” on potential trades. It ensures that you aren’t ignoring inflation or commission drag in your pursuit of alpha.
For the Long-Term Planner
If you are using this as a proxy index fund calculator or s&p 500 calculator, it helps you plan for retirement. You can input conservative estimates for market growth and see if your current savings rate will actually get you to your goal number.
Conclusion of Stock Calculator
In the complex world of finance, clarity is power. An online stock calculator provides that clarity. It strips away the noise and hype, leaving you with cold, hard numbers. From the initial input of your share count to the final visualization of your inflation-adjusted return, every step of the process is designed to make you a smarter, more conscious capital allocator.
Whether you are analyzing a dividend aristocrat, a high-flying tech stock, or a broad market index, the ability to forecast and review your returns is non-negotiable. Don’t leave your financial future to guesswork. Use the tool, run the numbers, and invest with the confidence that comes from knowing exactly where you stand.
Start using the stock calculator today to transform your investment strategy from a guessing game into a precise science. Your future self—and your portfolio—will thank you.
FAQs of Stock Calculator
Why is it important to use a stock calculator instead of just checking the current share price?
Checking the share price only tells you part of the story. A dedicated stock calculator gives you the complete picture of your investment’s health by factoring in critical details that a simple price check misses, such as:
Trading Commissions: The fees you paid to buy or sell, which eat into your profits.
Dividend Growth: The compound interest earned from reinvested payouts over months or years.
Inflation: How much purchasing power your money has lost over the holding period.
By using this tool, you can see your “Real Return”—the actual profit you have made after expenses and inflation—rather than just a gross percentage. This clarity allows you to make smarter decisions based on your actual bottom line.
Does the stock calculator factor in dividends, and why does that matter for my total return?
Yes, our stock calculator includes a comprehensive section dedicated to dividend analysis because dividends are a crucial component of long-term wealth building. While stock price appreciation gets the most attention, dividends can account for a significant portion of your total gains.
The calculator allows you to input:
Annual Dividend Per Share: The cash amount paid out by the company.
Dividend Yield: The percentage return relative to the stock price.
Dividend Growth Rate: The annual percentage increase in payouts.
By including these figures, the tool calculates your Total Return, which combines your capital gains (stock price increase) with your dividend income. This is essential because ignoring dividends can lead you to drastically underestimate your investment’s performance, especially for long-term holdings where reinvested dividends compound over time.
How does inflation affect my investment returns, and does this tool account for it?
Yes, our stock calculator includes a specific feature to adjust for inflation, which is critical for understanding the true value of your wealth. Inflation represents the rate at which the purchasing power of money declines over time.
If your stock portfolio grows by 8% in a year, but inflation is running at 3%, your Real Return—what you can actually buy with that profit—is only about 5%. Ignoring this “silent cost” can lead to overestimating your financial security.
The calculator handles this by:
Allowing Custom Input: You can enter the current or expected Inflation Rate in the “Additional Metrics” section.
Calculating Real Return: The results section clearly displays an inflation-adjusted figure alongside your nominal return.
Using this feature is essential for accurate long-term planning, such as retirement goals, ensuring you understand exactly how much purchasing power your investment is generating.