Mastering Metrics with the Sales Conversion Rate Calculator
Marketing often feels like a guessing game. You launch a campaign, spend money on ads, and watch the traffic roll in. But traffic alone doesn’t pay the bills. The real measure of success lies in how many of those visitors actually take action. This is where understanding your numbers becomes critical. Instead of relying on gut feelings, you can use a dedicated tool to find the truth hidden in your data.
That tool is the sales conversion rate calculator.
Whether you are a seasoned digital marketer or a small business owner just starting out, knowing exactly how well your pages perform is non-negotiable. This guide will walk you through every inch of this tool. We will explore the interface, break down the different analysis modes, and show you exactly how to interpret the results to make smarter business decisions.
First Impressions: A Clean, Focused Interface
When you first load the sales conversion rate calculator, you are greeted by a design that prioritizes clarity. The entire tool sits within a vibrant, gradient purple background container that immediately draws the eye. Centered within this space is a clean, white rounded card layout. This central card is where all the magic happens.
At the very top, you will see a centered title accompanied by an icon, signaling the tool’s purpose. The design is responsive, meaning it adjusts fluidly whether you are accessing it from a large desktop monitor or checking stats quickly on your mobile phone. The interface is divided into three distinct tabs, which are clearly visible at the top of the white card:
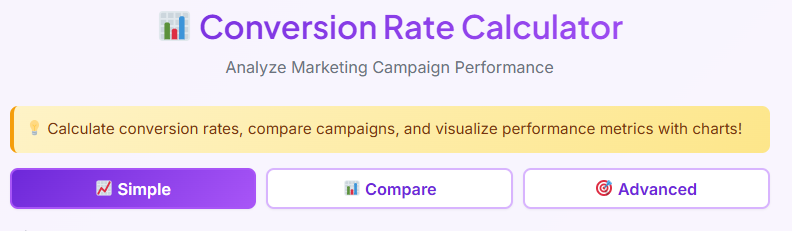
- Simple
- Compare
- Advanced
These tabs allow you to switch between different modes of analysis depending on how deep you need to dive into your data. Let’s explore what happens when you interact with each section of the sales conversion rate calculator.
The Simple Tab: Quick Checks for Instant Insights
The “Simple” tab is the default view. It is perfect for when you need a quick snapshot of a single campaign without getting bogged down in complex financial metrics.
Inputting Your Data
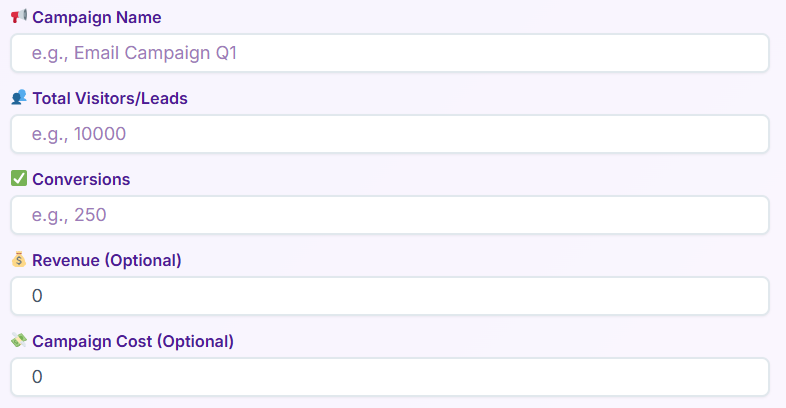
In this view, the layout is straightforward. You are presented with a few clear input fields. The first is “Campaign Name,” which helps you label your calculation. Below that, you will find the “Total Visitors / Leads” field. Here, you simply type in the total number of people who landed on your page or saw your ad.
Next is the “Conversions” field. This is where you enter the number of people who completed the desired action, such as buying a product or signing up for a newsletter.
There are two optional fields here as well: “Revenue” and “Campaign Cost.” While you can use the sales conversion rate calculator without them, adding these figures unlocks more valuable data regarding your earnings.
Generating Results
Once your numbers are in, you click the prominent “Calculate” button. If you have made a mistake—for example, entering more conversions than visitors—an error alert box will immediately pop up to let you know the math doesn’t add up.
If the data is valid, the results section appears instantly. You will see a grid of result cards displaying your metrics. A summary box provides a quick overview, but the most helpful feature here is the insight message. The tool analyzes your percentage and labels the performance as “Excellent,” “Good,” or “Low.” These insights help you understand if your conversion rate calc outcomes are meeting industry standards or if you need to optimize your page.
You will also see your data formatted with clear units and percentages, making it easy to read at a glance. If you want to start over, a “Reset” button clears all fields so you can run a new scenario through the sales conversion rate calculator.
The Compare Tab: Battle of the Campaigns
Marketing is rarely about doing just one thing. Often, you are running A/B tests or managing traffic from multiple sources like Facebook, Google, and email. This is where the “Compare” tab becomes essential.
Managing Multiple Inputs
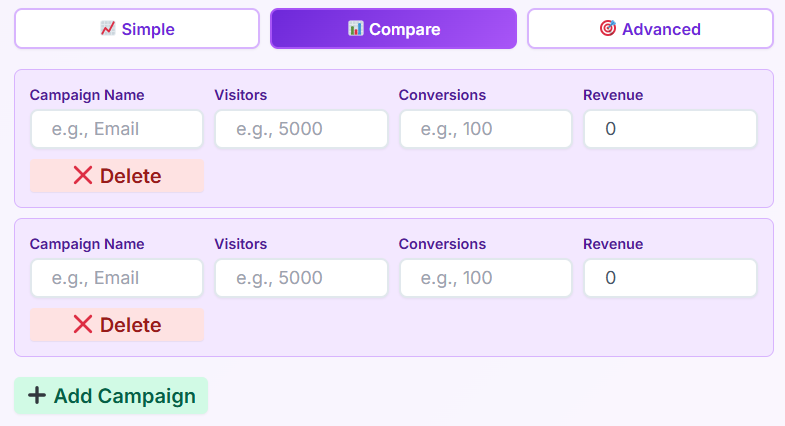
When you click on the “Compare” tab, the interface changes to accommodate multiple rows of data. You aren’t limited to just one scenario here. You will see an “Add Campaign” button that allows you to stack different campaigns against each other.
Each row represents a separate campaign with its own set of inputs. You can name them—for instance, “Facebook Ads” vs. “Organic Search”—and enter the visitor and conversion data for each. If you add a row by mistake, a “Delete campaign” button sits next to each entry, allowing you to remove it instantly to keep your workspace tidy.
Visualizing the Winner
After entering the data for two or more campaigns, you click the “Compare Campaigns” button. The sales conversion rate calculator then generates a comprehensive results section designed for side-by-side analysis.
First, you will see a horizontal bar chart displaying the conversion rates of each campaign. This visual aid makes it immediately obvious which campaign is performing better. Below that, a second bar chart breaks down visitors versus conversions, helping you visualize the scale of traffic alongside success rates.
A comparison table lists the hard numbers in a grid, but the tool goes a step further by highlighting the “Best campaign” in a summary section. This feature eliminates the need for mental math, pointing you directly to the winner. Just like the Simple tab, a “Reset” button allows you to wipe the slate clean.
The Advanced Tab: Deep Financial Analysis
For business owners and analysts who need to know the bottom line, the “Advanced” tab is the powerhouse of the sales conversion rate calculator. This section moves beyond simple percentages and looks at profitability and return on investment (ROI).

Granular Data Entry
The inputs here are more detailed. Along with “Campaign Name,” “Visitors,” and “Conversions,” the “Revenue” and “Campaign Cost” fields become crucial rather than optional. Additionally, you will see a field for “Campaign duration (days).” This allows the tool to calculate time-based metrics, which is vital for understanding how fast you are earning your money back.
Strategic Outputs
Upon calculating, the advanced output cards populate with high-level financial metrics. You will see the standard conversion rate percentage, but you also get:
- Average Order Value (AOV): How much revenue each conversion brings in on average.
- Cost Per Conversion: How much you spent to acquire a single customer.
- ROI: The return on investment percentage, telling you if your campaign is profitable.
- Profit Margin: The actual profit expressed as a percentage.
- Daily Metrics: Estimates of your daily traffic and sales based on the duration you entered.
- Payback Days: An estimate of how long it takes to recover your ad spend.
- Lifetime Value per Visitor: How much every single click is worth to your business.
The tool also provides insight messages based on your ROI, helping you decide if you should scale the campaign or pause it. This level of detail transforms the sales conversion rate calculator from a simple math tool into a strategic advisor.
Visualizations and Charts
Across the Compare and Advanced tabs, the sales conversion rate calculator uses visual elements to help you digest data faster. The bar charts are rendered with distinct colors to differentiate between metrics like visitors, conversions, and costs.
Responsive resizing ensures that these charts look just as good on a smartphone screen as they do on a desktop monitor. When you hover over the bars, tooltips appear, revealing specific numbers that might be hard to estimate just by looking at the bar height. These visual comparison benefits are huge for creating mental snapshots of your performance without getting lost in spreadsheets.
Exporting Your Reports
Once you have crunched the numbers, you often need to share them. Maybe you need to show a client their ROI, or perhaps you need to present quarterly results to a stakeholder. The sales conversion rate calculator includes a dedicated Export Section for this purpose.
Located typically at the bottom of the results area, you will find a “Download PDF” button and a “Print” button. These buttons appear once a calculation has been successfully performed. Clicking “Download PDF” generates a clean, professional document containing your inputs, results, and charts. This is ideal for attaching to emails or saving for your records. The “Print” button formats the current view for physical paper or a “Save as PDF” browser dialog, ensuring the layout remains intact on the printed page.
Real-Life Examples of the Tool in Action
To understand how versatile the sales conversion rate calculator is, let’s look at a few practical examples of how different professionals might use it in their daily workflows.
Scenario 1: The Email Marketing Campaign
Imagine a marketing manager named Sarah. She just sent out a massive newsletter to 10,000 subscribers promoting a new e-book. She wants to know if the email subject line and landing page were effective.
Sarah opens the sales conversion rate calculator and selects the “Simple” tab. She enters “Q3 E-book Launch” as the campaign name. She inputs 10,000 into the Total Visitors field (representing email opens that clicked through) and enters 450 in the Conversions field (people who downloaded the book). She hits “Calculate.” The tool instantly tells her she has a 4.5% conversion rate and labels it as “Good.” She now knows her campaign is healthy without needing a spreadsheet.
Scenario 2: The E-commerce Ad Spend Battle
Next, consider Mike, who runs a Shopify store selling hiking gear. He is running two ads: one on Facebook and one on Instagram. He isn’t sure which one deserves more budget.
Mike switches to the “Compare” tab on the sales conversion rate calculator. He creates two rows.
- Row 1: Facebook Ads – 1,000 clicks, 25 sales.
- Row 2: Instagram Ads – 800 clicks, 30 sales.
He hits “Compare Campaigns.” The horizontal bar chart visually shows that Instagram is converting at a much higher rate (3.75%) compared to Facebook (2.5%), even though Facebook brought more traffic. The summary highlights Instagram as the “Best Campaign.” Mike decides to shift his budget to Instagram immediately.
Scenario 3: The SaaS Startup Founder
Finally, there is Elena, the founder of a software startup. She is pitching to investors and needs to demonstrate that her paid search strategy is profitable. She uses the “Advanced” tab of the sales conversion rate calculator.
She inputs her campaign data: 5,000 visitors, 100 conversions, $10,000 in revenue, and $2,000 in costs over 30 days. The tool calculates her ROI, but more importantly, it shows her “Cost Per Conversion” and “Profit Margin.” She exports this data using the “Download PDF” button and includes the clean, professional report directly in her investor presentation.
Who Benefits from This Tool?
The utility of the sales conversion rate calculator spans across various roles in the digital landscape. It is not just for math whizzes; it is for anyone who cares about growth.
Digital Marketers
For marketers, this tool is a daily essential. It helps answer the question, “Is my strategy working?” quickly. By knowing how to calculate conversion rate metrics instantly, marketers can pivot strategies in real-time rather than waiting for end-of-month reports.
E-commerce Store Owners
Store owners live and die by their margins. Using the Advanced tab allows them to see not just sales, but profitability. It helps them understand if the cost of acquiring a customer is eating up all their profit, ensuring their business model remains sustainable.
Sales Teams
Sales professionals can use the tool to reverse-engineer their goals. If they know they need 50 deals (conversions) and their historic conversion rate is 5%, they can use the calculator to determine exactly how many leads (visitors) they need to prospect to hit that target.
Agencies
Marketing agencies manage dozens of clients. The “Compare” feature allows account managers to show clients A/B test results clearly. The export feature allows them to generate branded, professional-looking reports that prove the value of their services.
Startup Founders
Founders need to know their unit economics. Metrics like Lifetime Value per Visitor and Payback Days are critical for survival. The sales conversion rate calculator provides these complex financial insights without requiring the founder to build complex Excel models.
Business Analysts
Analysts can use the tool to spot trends over time. By running different scenarios through the tool, they can forecast future performance and set realistic benchmarks for the rest of the team.
Why Accuracy Matters
When you learn how to calculate conversion data correctly, you stop wasting money. A slight difference in conversion rate—say, moving from 1% to 2%—literally doubles your revenue without you needing to buy a single extra click. The sales conversion rate calculator gives you the visibility needed to make that jump.
It helps you spot the “leaky buckets” in your funnel. If the tool shows a “Low” performance insight, you know you have a problem with your landing page or offer. Without this clarity, you might blame your traffic source, which could be perfectly fine.
Related Business & Marketing Tools
To run a successful business, you need a suite of tools to handle different aspects of your finances and planning. Here are a few others that complement the analysis you are doing today:
- Hourly Rate Calculator – Calculate hourly rates from annual salary to ensure you are pricing your services correctly.
- Business Valuation Calculator – Estimate your business worth and valuation to plan for future exits or investment rounds.
- Depreciation Calculator – Calculate asset depreciation over time to keep your accounting books accurate and up to date.
Understanding the Math Behind the Tool
While the sales conversion rate calculator handles the heavy lifting, it is helpful to understand the basic concepts. The standard conversion rate formula is simply (Conversions / Total Visitors) × 100. It is a percentage that tells you the efficiency of your traffic.
However, when you start looking at conversion rate sales data, you need to factor in revenue. This is why the Advanced tab is so powerful. It doesn’t just look at the raw count of actions; it looks at the monetary value of those actions. This distinction is what separates a vanity metric from a business metric.
Conclusion
In the fast-moving world of online business, data is your compass. The sales conversion rate calculator is more than just a utility; it is a framework for making better decisions. By providing a clear, user-friendly interface with Simple, Compare, and Advanced modes, it meets you exactly where you are in your analytics journey.
Whether you are checking a quick stat on the fly or preparing a deep-dive report for a board meeting, the clean design, intuitive inputs, and robust visualization options make the process seamless. You no longer need to fear the math or guess your way to success.
Using the sales conversion rate calculator empowers you to take control of your campaigns. It highlights what is working, exposes what isn’t, and gives you the concrete evidence you need to grow your business. Bookmark the tool, export your reports, and start turning more of your visitors into valuable customers today. The path to higher revenue starts with understanding your conversion rates, and this tool is the perfect first step.
FAQs
What is a sales conversion rate and why is it important?
A sales conversion rate is the percentage of your website visitors or leads who complete a desired action, such as making a purchase, signing up for a newsletter, or filling out a contact form. This metric is crucial because it directly measures the effectiveness of your marketing and sales efforts. A high conversion rate means your offer and messaging are resonating with your audience, while a low rate can indicate that something needs to be improved.
Can I compare the performance of different marketing campaigns with this tool?
Yes, absolutely. The calculator includes a “Compare” feature designed for this exact purpose. You can add multiple campaigns—for example, “Facebook Ads” vs. “Google Ads”—and input the visitor and conversion data for each. The tool will then generate a side-by-side comparison with visual charts, highlighting which campaign is performing better and helping you decide where to best allocate your budget.
What kind of financial insights can the advanced calculator provide?
The “Advanced” tab moves beyond simple conversion percentages to give you a clear picture of your campaign’s profitability. By entering your revenue and costs, you can instantly see key financial metrics like:
Return on Investment (ROI): Tells you if your campaign is making more money than it costs.
Cost Per Conversion: Shows exactly how much you spend to acquire each new customer.
Average Order Value (AOV): Calculates the average revenue generated per sale.
Profit Margin: Reveals the actual profit you are making from your campaign.