Mastering Your Earnings with Our Sales Commission Calculator
In the competitive world of sales, clarity is just as important as the hustle. Whether you are closing deals on a showroom floor, managing a remote team of high-performers, or running a freelance business, knowing exactly what you’ve earned is the fuel that keeps you going. However, compensation structures can be messy. Spreadsheets break, formulas get deleted, and mental math is prone to errors. This is where a dedicated sales commission calculator becomes an essential part of your daily toolkit.
We have designed a tool that removes the guesswork from your paycheck. It is not just about adding numbers together; it is about providing a clean, visual interface that lets you see your potential earnings in seconds. By focusing on a user-friendly experience, this sales commission calculator allows sales professionals and managers to calculate complex tier-based incentives or simple flat-rate bonuses without opening a single spreadsheet.
The goal is transparency. When you know how to calculate commission accurately, you can plan your finances, set better targets, and stay motivated. Let’s take a deep dive into how this tool looks, feels, and functions, walking through every visual element you will encounter on the screen.
Tool Layout & Design
When you first load the sales commission calculator, you are greeted with a design that prioritizes focus. We have done away with clutter to ensure that your attention remains on the metrics that matter.
The background sets the tone for a modern, premium experience. It features a rich, gradient purple backdrop that transitions smoothly from a deep violet to a lighter lavender. This choice of color isn’t accidental; it provides a calming yet professional contrast to the central workspace, ensuring that the calculator itself pops off the screen.
The central calculator card is pure white, featuring rounded corners that soften the look, making the tool feel approachable rather than rigid. It floats in the center of the page with a subtle drop shadow, giving it a sense of depth and dimensionality. This card is where all the action happens.
The layout is responsive and fluid. If you are accessing this from a desktop, the spacing is generous, allowing for a comfortable view of all data fields. On mobile devices, the card snaps neatly to the width of your screen, ensuring that buttons remain tappable and text remains legible without the need to pinch or zoom. The design language is clean, utilizing sans-serif typography that is easy to read at a glance, which is crucial when you are quickly trying to figure out how to work out commission on the go.
Title & Info Box
At the very top of the white calculator card, you will see the primary heading: 💰 Sales Commission Calculator. The inclusion of the money bag emoji adds a touch of personality and immediately signals the tool’s purpose. The text is bold and dark, anchoring the top of the interface.
Directly beneath the main title is a short, descriptive subtitle. It briefly invites you to input your sales data, setting a welcoming tone.
Just below the header section, there is a distinct yellow information box. This box has a soft yellow background with a slightly darker yellow border, ensuring it stands out without being alarming. Inside, a brief text explanation guides you on what the calculator does—helping you estimate earnings based on revenue and rates. This serves as a quick onboarding element for first-time users, ensuring that anyone wondering how to compute commission rate logic knows they are in the right place.
Tabs Section (Commission Types)
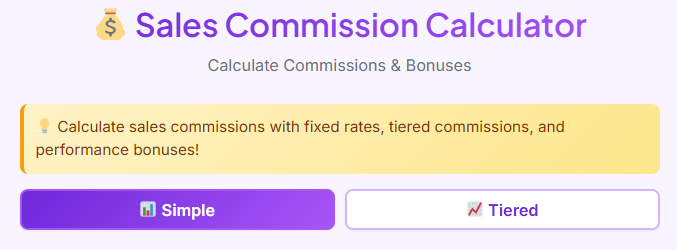
Sales compensation isn’t one-size-fits-all, and neither is this interface. Immediately following the intro section, you will notice a navigation bar consisting of two distinct tabs: Simple and Tiered.
These tabs allow you to switch between different calculation modes depending on your compensation structure.
- Simple Tab: This is the default view. It is designed for straightforward, flat-rate percentage deals.
- Tiered Tab: This view is for more complex structures where rates change based on how much you sell.
Visually, the active tab is highlighted with a solid purple background and white text, matching the page’s theme. The inactive tab sits quietly with a white background and grey text. When you hover your mouse cursor over the inactive tab, there is a subtle change in shade, providing visual feedback that the element is clickable. Switching between tabs is instantaneous; the content below changes immediately without a page reload, allowing you to toggle back and forth to compare different scenarios seamlessly.
Simple Commission Input Section
Staying on the Simple tab, the interface presents a series of clean, well-spaced input fields. This section is designed for speed. If you are looking for a quick answer on how is commission calculated for a single deal or month, this is where you work.
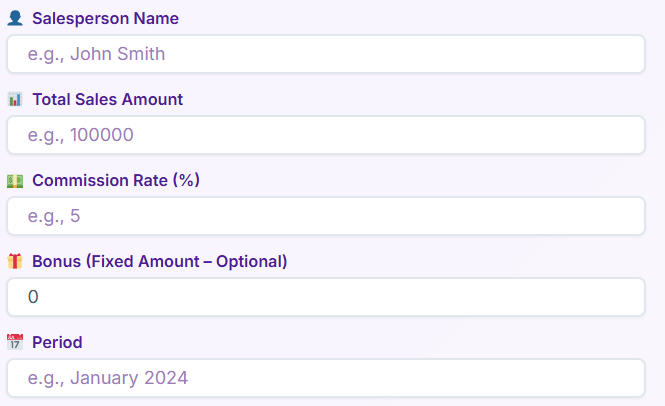
The fields are stacked vertically for logical flow:
- Salesperson Name: The first field asks for a name. It features a simple user icon on the left. The placeholder text invites you to type, adding a layer of personalization to the final report.
- Total Sales Amount: This is the core metric. The field is marked with a dollar sign (or currency symbol) icon. Here, you input the gross revenue generated. The text input is large and legible, ensuring you don’t miss a zero.
- Commission Rate (%): To the right or below the sales amount (depending on your screen width), you’ll find the percentage field. Marked with a percentage icon, this is where you define your cut.
- Fixed Bonus (Optional): Not all earnings are percentage-based. This field allows you to add a flat cash bonus. The placeholder text marks it as “Optional,” so you know it’s safe to leave blank if it doesn’t apply.
- Period: Finally, a dropdown or text field lets you specify the timeframe—Monthly, Quarterly, or Yearly. This adds context to the final result card.
Each input field is outlined in a soft grey that turns into a vibrant purple when you click into it to type. This “active state” focus helps you keep track of where you are in the form.
Buttons & User Interaction (Simple Tab)
Once your data is entered, the interface guides you toward the bottom of the input section where two primary buttons reside.
The main action button is labeled Calculate Commission. It spans the full width of the container on mobile or sits prominently on the right on desktop. It features a bold purple background with white text. When you hover over this button, it darkens slightly and lifts, offering a satisfying tactile feel to the digital click. It is designed to be the most obvious element on the screen, encouraging you to hit it as soon as your data is ready.
Next to it (or below it) is a secondary Reset button. This is styled more subtly—often a ghost button with a transparent background and a purple outline. This allows you to clear the form instantly if you want to start over with fresh numbers.
If you try to click “Calculate” without entering the required Total Sales or Commission Rate, the sales commission calculator is smart enough to stop you. A small, red error alert box will appear instantly near the button, gently reminding you to fill in the missing fields. This ensures you never get a “zero” result due to a typo.
Simple Commission Results Section
After clicking Calculate, the magic happens. The area below the buttons expands to reveal the Simple Commission Results section. This transition is smooth, sliding down to display your earnings.
The results are broken down into digestible cards:
- Base Commission: This card displays the raw calculation (Sales × Rate). It features a generic calculator emoji and a large, bold number representing the dollar amount.
- Bonus Amount: If you entered a fixed bonus, it appears here in its own card, highlighted separately so you can see exactly where your money is coming from.
- Total Earnings: This is the star of the show. This card is highlighted in a soft green box to signify “money in the pocket.” The font size is larger here, making the final figure unmistakable.
Each result card features a small “Copy” icon in the top right corner. Clicking this copies the value to your clipboard, perfect for pasting into an email or a finance app.
At the very bottom of the results, a Summary Box appears. It creates a natural sentence using the name and period you entered, such as: “John’s total earnings for the Monthly period.” This humanizes the data, turning raw numbers into a statement.
💳
Payment Terms Calculator
Calculate payment terms and due dates
Tiered Commission Input Section
Now, let’s switch gears. Clicking the Tiered tab at the top changes the interface to accommodate more sophisticated compensation plans. This is where the sales commission calculator truly shines for advanced users who need to know how to calculate commission based on sliding scales.
The initial inputs are similar but slightly different to match the logic of tiered sales:
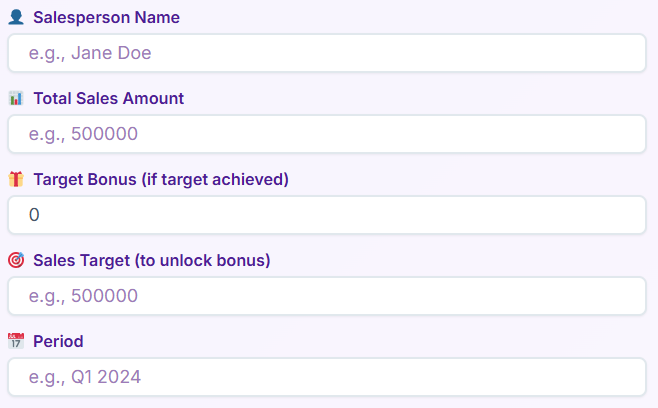
- Salesperson Name: Still present for personalization.
- Total Sales Amount: The total revenue achieved.
- Target Bonus: A field to input a bonus that is unlocked only if a specific target is hit.
- Sales Target: The revenue goal required to unlock said bonus.
- Period: The timeframe for these targets.
The layout remains clean, but you will notice the absence of a single “Commission Rate” field. That is because the rate is no longer static—it is dynamic, handled by the section below.
Commission Tiers Builder
Below the basic inputs on the Tiered tab lies the Commission Tiers Builder. This is a visual grid that allows you to construct the “steps” of your commission structure.
Visually, this looks like a stacked list of rows. Each row represents a tier and contains three fields:
- From ($): The starting dollar amount for this tier.
- To ($): The cap for this tier.
- Rate (%): The percentage earned on sales falling within this range.
To the right of each row is a small, red trash can icon, allowing you to delete a tier if you made a mistake.
Below the rows, there is a prominent + Add Tier button. It is styled distinctly (often with a dashed border or a plus icon) to encourage you to build out your ladder. As you click it, a new row appears instantly at the bottom of the list.
This visual builder demystifies how is commission calculated in complex organizations. You can literally see the ladder: from $0 to $10,000 earns 5%, from $10,001 to $20,000 earns 7%, and so on. It empowers the user to replicate their contract exactly as it is written on paper.
Buttons & User Interaction (Tiered Tab)
Just like the Simple tab, the Tiered section concludes with a Calculate Tiered Commission button. It shares the same bold purple styling and hover effects.
However, the interaction logic here is slightly more robust. When you click Calculate, the tool visually scans your “Total Sales Amount” and runs it through the grid you built. If your tiers have gaps (e.g., Tier 1 ends at $10,000 and Tier 2 starts at $15,000), the tool might display a gentle warning or simply calculate based on the logic provided.
The Reset button is also present, allowing you to wipe the entire tier structure and start fresh. This is particularly useful for managers who are modeling completely different incentive plans for their teams.
Tiered Results Section
The results view for the Tiered tab provides a deeper level of detail. Because tiered calculations can be confusing, the sales commission calculator breaks it down step-by-step.
- Applicable Tier: A display that tells you which tier your final dollar landed in.
- Target Status: A visual indicator—often a green checkmark or a grey circle—showing whether you hit the “Sales Target” you entered earlier. If you hit it, a message like “Target Achieved!” appears in green text.
- Breakdown: You will see the Commission earned from the tiers separate from the Target Bonus.
- Total Earnings: Just like the simple tab, the grand total is highlighted in a large, green card.
There is also a detailed text summary that explains the logic: “You earned commission across 3 tiers and unlocked your target bonus.” This explanation helps users verify that the math aligns with their expectations, answering the question of how to work out commission on a granular level.
Real-Life Examples
To truly understand the power of this tool, let’s look at a few scenarios where a sales commission calculator saves the day.
Example 1: The Retail Associate
Imagine Sarah, who works in luxury retail. She sells $45,000 worth of goods this month. Her contract says she gets a flat 3% on everything. She opens the tool, clicks the Simple tab, types in $45,000 and 3%. Instantly, she sees she has made $1,350. She also remembers her manager mentioned a $500 spiff for selling old inventory. She adds that to the “Fixed Bonus” field. The tool updates immediately: $1,850. She copies the figure and texts her partner that dinner is on her.
Example 2: The SaaS Account Executive
Mark sells software. His comp plan is harder. He gets 10% on the first $10k, and 15% on everything above that up to $50k. He has closed $35,000 this quarter. He uses the Tiered tab. He builds two rows in the tier builder.
- Row 1: 0 to 10,000 at 10%
- Row 2: 10,001 to 50,000 at 15%
He hits calculate. The tool does the math, applying the 10% rate to the first chunk and the 15% rate to the remaining $25,000. Mark doesn’t have to worry about how to compute commission rate averages or weighted splits; the tool gives him the final number instantly.
Use Cases
This sales commission calculator is versatile enough to serve a wide variety of professionals.
Sales Professionals: obviously, this is for you. It helps you audit your paycheck to ensure you haven’t been underpaid. It also helps you forecast: “If I close this one last deal, how much extra will I make?”
Sales Managers: You can use this during team meetings. Projecting incentives on a screen helps motivate the team. It is also excellent for designing new compensation plans. You can model different tier structures to see if they are sustainable for the business before rolling them out.
HR Teams: When sending out offer letters, HR can use this tool to double-check that the “On-Target Earnings” (OTE) they are promising are mathematically accurate based on the quotas set.
Freelancers: If you work on a “retainer plus success fee” model, the Simple tab is perfect for calculating your end-of-month invoices.
🎯
Conversion Rate Calculator
Calculate conversion rates for marketing campaigns
Small Businesses: For owners who don’t have expensive payroll software, this free tool acts as a payroll assistant, ensuring you pay your staff correctly and on time.
Enterprises: Even in large companies with complex software, sales reps often find their internal dashboards slow or confusing. A fast, front-end tool like this provides a quick “sanity check” against the official numbers.
📈
Growth Rate Calculator
Calculate business growth rate over time
Conclusion
At the end of the day, sales is about results. You put in the work, and you deserve to know exactly what that work is worth. Relying on rough mental estimates or back-of-the-napkin math is a recipe for frustration. By using a dedicated sales commission calculator, you gain control over your financial picture.
This tool was built to be effortless. From the intuitive Simple tab for quick checks to the robust Tiered builder for complex incentives, every pixel is designed to give you the answer you need without the headache. The layout is clean, the buttons are responsive, and the results are crystal clear.
Whether you are trying to figure out how is commission calculated for a new job offer or simply double-checking your monthly bonus, this tool is your reliable partner. Bookmark it, use it, and focus on what you do best—closing the deal.
FAQs of Sales Commission Calculator
Can I calculate commission rates that change based on how much I sell?
Yes! Our calculator features a dedicated “Tiered” tab designed exactly for this purpose. You can build your own commission ladder by adding multiple tiers, setting specific sales ranges (e.g., $0–$10,000), and assigning a unique percentage rate to each one. This is perfect for complex sales structures where high performers earn a higher percentage on revenue that exceeds a certain threshold.
Is my sales data private, or is it saved somewhere?
Your privacy is our priority. This tool processes all calculations instantly on your device, meaning none of the sales figures, names, or commission rates you enter are ever sent to a server or stored in a database. Once you close the tab or refresh the page, your data is completely wiped, ensuring your financial information remains confidential.
Can I add a one-time bonus to my commission calculation?
Absolutely. Whether you earned a “spiff” for a specific product or hit a quarterly incentive, you don’t need to do separate math. In the “Simple” tab, you can enter a flat dollar amount in the “Fixed Bonus” field. In the “Tiered” tab, you can set a “Target Bonus” that unlocks automatically when your total sales meet the specific goal you define.