SIP Investment Details
Maturity Amount
$114,943
Total Investment
$60,000
Total Returns
$54,943
Return on Investment
91.57%
Investment Breakdown
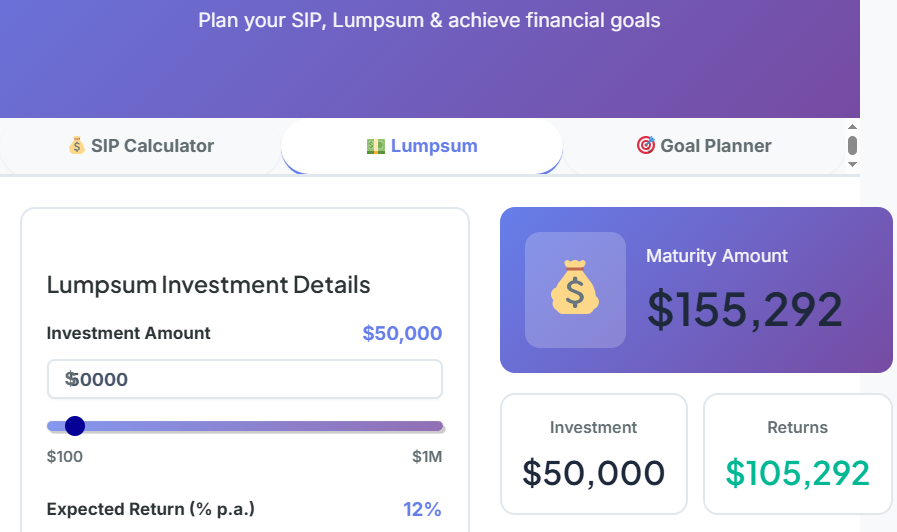
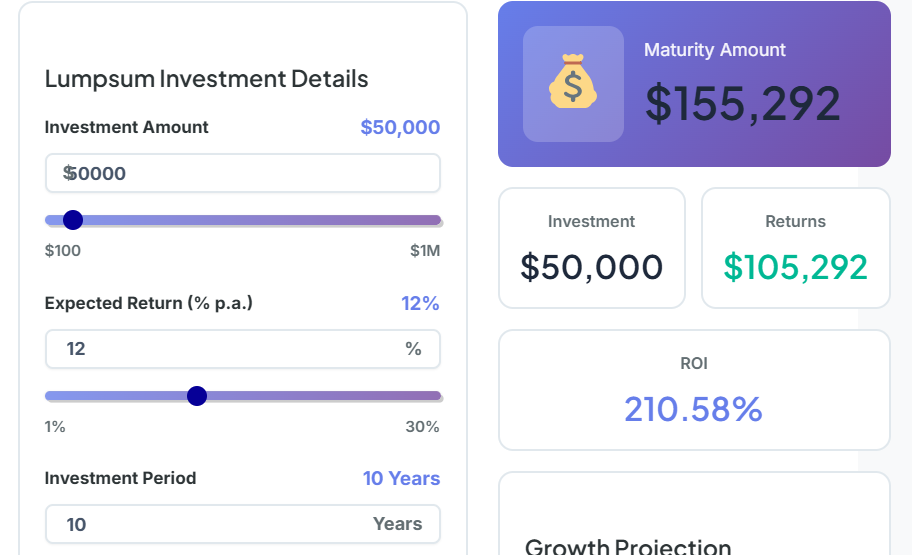
Lumpsum Investment Details
Maturity Amount
$155,292
Investment
$50,000
Returns
$105,292
ROI
210.58%
Growth Projection
Financial Goal Details
Monthly SIP Required
$1,021
Target Amount
$100,000
Gap to Cover
$90,000
Total Investment Needed
$61,267
Goal Achievement
The Ultimate Guide to Mastering Your Wealth: A Deep Dive Into the Lumpsum Calculator
There is a specific kind of anxiety that comes with having a sudden influx of money. It sounds like a good problem to have—and it is—but it’s a problem nonetheless. Maybe you just received a performance bonus at work, or perhaps an insurance policy matured. Maybe you sold a property or received an inheritance. Suddenly, your bank account looks different, and the weight of responsibility settles in. You know that letting that money sit idle in a checking account losing value to inflation is a mistake. But investing it all at once? That feels terrifying.
We are often taught to save little by little, month by month. We understand the rhythm of a paycheck. But a lump sum? That is a different beast entirely. It requires a shift in mindset from “accumulation” to “deployment.” This is where a specialized tool like a Lumpsum Calculator becomes indispensable. It stops being about guessing and starts being about engineering your future.
As a financial consultant who has sat across the table from hundreds of families, I can tell you that the difference between those who build generational wealth and those who just “get by” isn’t usually luck. It’s math. It’s the ability to look at a number today and understand exactly what it could be worth in ten, twenty, or thirty years.
In this comprehensive guide, we are going to explore every facet of lump sum investing. We won’t just talk theory; we will walk through exactly how to use our Lumpsum Calculator to make decisions that let you sleep soundly at night. We will look at real-life scenarios, common pitfalls, and advanced strategies that usually only pros talk about.
If you are ready to stop wondering “what if” and start knowing “what is,” you are in the right place.
Why This Calculator Matters More Than You Think
Most people treat investing like a dark art. They think it requires intuition or inside information. The truth is far boring—and far more powerful. Successful investing is simply the application of compound interest over time. However, the human brain is notoriously bad at calculating exponential growth.
If I ask you what $10,000 becomes in 20 years at 10% interest, your brain might guess $20,000 or maybe $30,000. When a Lumpsum Calculator reveals the answer is actually closer to $67,000, the reaction is almost always shock.
That shock is why this tool matters. It bridges the gap between your linear intuition and exponential reality.
The Cost of Inaction
Let’s be honest about the alternative. Without a clear projection, most people do nothing. They leave the cash in a savings account earning 0.5%. They tell themselves they are “waiting for the right time.” Meanwhile, inflation eats away at their purchasing power like termites in a wooden house. A Lumpsum Calculator shows you the opportunity cost of that inaction. It doesn’t just show you what you could make; by inverse, it shows you what you are losing every day you sit on the sidelines.
Emotional Anchoring
Investing is emotional. When the market dips, panic sets in. When you use a Lumpsum Calculator, you create an emotional anchor. You can look at your 15-year projection and remind yourself, “I am not investing for today’s headlines; I am investing for that number on the screen.” It transforms vague hope into a concrete roadmap.
Step-by-Step Usage: How to Use This Tool Like a Pro
Using our Lumpsum Calculator is designed to be intuitive, but garbage in equals garbage out. To get results you can actually build a life around, you need to use it correctly. Let’s break down the process.
1. Selecting the Right Mode
When you open the tool, you’ll see options. Since we are dealing with a one-time investment, ensure you are on the “Lumpsum” tab. It might be tempting to click around, but the math for a sips cost calculator is fundamentally different from a lump sum. SIPs add new capital monthly; lump sums rely entirely on the initial seed capital growing on its own.
2. The Investment Amount (Principal)
This is your starting point. Enter the total amount of cash you have available to deploy right now.
- Pro Tip: Do not include your emergency fund here. If you have $50,000, but you need $10,000 for a rainy day buffer, only enter $40,000 into the Lumpsum Calculator. You never want to be forced to sell your investments during a downturn because you ran out of liquid cash.
3. The Expected Return Rate
This input requires the most thought. What number should you put here?
- Conservative (6-8%): Use this if you have a balanced portfolio of bonds and stable stocks, or if you are nearing retirement and can’t afford big risks.
- Moderate (8-10%): This is the standard setting for broad market index funds (like the S&P 500) over long periods. It’s what you might see in a standard dave ramsey investment calculator.
- Aggressive (12-15%): Use this only for high-growth equity mutual funds or small-cap stocks, and only if your time horizon is 10+ years.
4. The Time Period (Tenure)
Slide the bar to reflect how long you can leave this money untouched. This is crucial. The Lumpsum Calculator assumes you do not withdraw a single penny during this time. If you plan to take money out in 5 years, do not set the slider to 20 years.
5. Interpreting the Results
Once you hit calculate, you will see three key figures:
- Invested Amount: Your principal.
- Est. Returns: The profit generated by the market.
- Total Value: The sum of both.
Pay special attention to the “Est. Returns.” In long-term scenarios, you will often see this number exceed your invested amount. That is the crossover point where your money is working harder than you did to earn it.
Deep Explanation of Each Part: What’s Happening Behind the Scenes?
To truly trust the numbers, you need to understand the mechanics. You don’t need to be a mathematician, but you should understand the levers you are pulling.
The Engine: Compound Interest
The Lumpsum Calculator uses the compound interest formula. Unlike simple interest, where you only earn on your principal, compound interest earns on your principal plus the interest you’ve already earned.
Think of a snowball rolling down a hill. At the top, it’s small (your lump sum). As it rolls, it picks up more snow. The surface area gets bigger, so it picks up even more snow with every rotation. By the time it hits the bottom (maturity), it’s an avalanche. The calculator is simply measuring the height of the hill (time) and the stickiness of the snow (rate of return).
The Variable: Volatility vs. Average
When you type “10%” into the Lumpsum Calculator, the tool applies a smooth, steady 10% growth every single year. In reality, markets are jagged. One year might be +20%, the next -5%, the next +15%.
Does this make the calculator wrong? No. Over long periods (10+ years), these ups and downs smooth out into an average. The calculator shows you the destination, even if it can’t predict the bumpy road to get there. This is why we emphasize using it as a long-term planning tool, not a short-term prediction engine.
The Silent Killer: Inflation
While the calculator shows you the nominal value (the number on the check), it doesn’t automatically subtract inflation. A million dollars in 2045 won’t buy what a million dollars buys today.
- Consultant Insight: If you want to see the “real” value in today’s purchasing power, subtract 3% from your expected return. If you expect the market to give 10%, enter 7% into the Lumpsum Calculator. The result will be a number that feels “real” to your current lifestyle.
Real Examples: Putting the Math to the Test
Let’s look at three distinct individuals using the Lumpsum Calculator to make life decisions.
Case Study 1: The Young Professional
Name: Sarah, 28
Windfall: $20,000 bonus
Goal: Wealth creation
Sarah puts $20,000 into the calculator. She chooses an aggressive 12% return because she is young, and sets the time for 30 years (retirement age).
- Result: $599,198.
Sarah is stunned. Her $20,000 bonus is essentially a $600,000 retirement fund if she just leaves it alone. She decides to invest it immediately into an equity mutual fund.
Case Study 2: The Late Starter
Name: David, 50
Windfall: $100,000 inheritance
Goal: Catch up on retirement
David inputs $100,000. He has less time, so he inputs 15 years. He chooses a moderate 8% return to be safe.
- Result: $317,216.
David realizes that while this triples his money, it isn’t enough to retire on alone. The Lumpsum Calculator helps him realize he needs to supplement this with monthly contributions. He navigates to the sips cost calculator to see how much extra he needs to add monthly to reach his $500,000 goal.
Case Study 3: The Risk-Averse Saver
Name: Elena, 40
Windfall: $50,000 from property sale
Goal: Safety
Elena is scared of the stock market. She wants to put the money in a Fixed Deposit (FD) at 6%. She runs the numbers for 20 years.
- Result: $160,356.
Then, she runs it at 10% (market rate). - Result: $336,374.
The Lumpsum Calculator shows her the price of her fear: over $175,000. She decides to compromise and put half in FD and half in the market.
Advanced Pro Insights: Beyond the Basics
Once you master the basic inputs, you can use the Lumpsum Calculator for sophisticated financial modeling.
1. The “Rule of 72” Validation
You can use the “Rule of 72” to mental-check the calculator. Divide 72 by your interest rate to see how fast your money doubles.
- At 12%, money doubles every 6 years (72/12).
- If you have $100k for 24 years (which is four 6-year cycles), it should double four times: 100 > 200 > 400 > 800 > 1.6M.
Check the Lumpsum Calculator. It will show almost exactly that. This helps you spot data entry errors immediately.
2. Tax Drag Modeling
If you are investing in a taxable account, your returns aren’t all yours. You can simulate taxes by reducing your input rate. If you are in a 20% tax bracket on capital gains, and you expect a 10% return, reduce your input rate by 20% (so, enter 8%). This gives you a “post-tax” view of your wealth, which is the only view that matters.
3. Goal Back-Calculation
Sometimes you know the destination but not the vehicle. If you need $500,000 in 10 years, you can play with the “Investment Amount” slider on the Lumpsum Calculator until the result hits $500,000. This tells you exactly how much cash you need to deploy today to hit that target without adding another dime later.
Multiple Real-Life Scenarios
The versatility of a Lumpsum Calculator extends far beyond just retirement planning.
The Wedding Fund
You have $15,000 today and want to get married in 5 years. Can you afford a $25,000 wedding?
- Input: $15,000
- Rate: 10%
- Time: 5 Years
- Result: $24,157.
- Verdict: You are close! You might need to save a tiny bit more, or find a slightly better performing fund. The calculator gives you permission to plan.
The College Education
Your child is born today. Grandparents gift $10,000. Is that enough for college in 18 years?
- Input: $10,000
- Rate: 12%
- Time: 18 Years
- Result: $76,900.
- Verdict: Depending on the college, this might cover tuition. It’s a massive head start that takes the pressure off your monthly budget.
The Debt Payoff Decision
You have a $20,000 credit card debt at 18% interest, and you have $20,000 cash. Should you pay it off or invest?
- Lumpsum Calculator (Investing): $20k at 10% for 5 years = $32,210. Profit = $12k.
- Credit Card Calculator (Debt): $20k at 18% for 5 years = You will pay roughly $18,000 in interest alone.
- Verdict: The “guaranteed return” of paying off 18% debt beats the “potential return” of 10% investment. The calculators make the math undeniable.
Benefits of Using Our Lumpsum Calculator
Why use this specific tool instead of a napkin or a complex spreadsheet?
- Visualizing the Curve: The hardest part of wealth building is the “boring middle” where gains seem slow. The graph generated by our Lumpsum Calculator shows you the hockey stick curve at the end, motivating you to persist.
- Scenario Comparison: You can toggle between 10% and 12% in a second. In a spreadsheet, you’d be rewriting formulas. This speed allows you to run “Best Case,” “Worst Case,” and “Base Case” scenarios in under a minute.
- Accuracy: Human error is real. It’s easy to miss a decimal point doing this manually. The calculator code is rigid and tested, ensuring the math is flawless every time.
- Integration: It works hand-in-hand with our other tools. You can calculate your take-home pay with the Salary Calculator to see how much surplus you have, then plug that surplus into the Lumpsum or sips cost calculator.
Expert Accuracy Tips
To get the most out of the Lumpsum Calculator, follow these accuracy guidelines:
- Be Conservative with Time: If you think you need the money in 10 years, run the calculation for 8 or 9 years. Life happens. Usually, people need liquidity sooner than they think. If the numbers still work at 8 years, you are safe.
- Understand “CAGR”: The rate you enter is the Compound Annual Growth Rate. If you are looking at a fund’s past performance, do not look at “absolute returns.” Look specifically for the CAGR figure. This is the only compatible input for a calculate mutual fund return projection.
- Factor in Fees: If you pay a financial advisor 1% a year, subtract that. If your fund has a 0.5% expense ratio, subtract that. Always input the net return.
FAQs
1. Is the Lumpsum Calculator accurate for the stock market?
It is mathematically accurate, but the market is not. The calculator assumes a straight line of growth. The market is a squiggly line. However, over long periods (10-15 years), the squiggly line usually averages out to the straight line you see in the calculator. Think of it as a compass, not a GPS.
2. Should I invest my lump sum all at once or slowly (SIP)?
This is the eternal debate. Mathematically, investing a lump sum all at once usually wins because your money is in the market longer. However, psychologically, it’s hard. If you invest $100k today and the market drops tomorrow, you’ll feel terrible. If you are nervous, use a Systematic Transfer Plan (STP). Put the lump sum in a safe debt fund and drip-feed it into equity. You can model the equity portion using a sips cost calculator.
How do I calculate mutual fund return if I don’t know the rate?
You can never know the future rate. However, you can look at the fund’s “Since Inception” CAGR or 10-year average. Use that as a baseline, but perhaps lower it by 1-2% to be safe. Past performance doesn’t guarantee future results.
What is the difference between a Financial Goals Calculator and this?
A Financial Goals Calculator works backward: “I need $1 million; how much do I save?” A Lumpsum Calculator works forward: “I have $50,000; what will it become?” They answer different questions but work great together.
Does this calculator handle inflation?
The standard output is “nominal” (today’s numbers). It does not automatically subtract inflation. You should lower your expected return rate (e.g., input 7% instead of 10%) to see an inflation-adjusted result.
Can I use this for real estate?
Absolutely. If you buy a rental property for $200,000 and expect it to appreciate 4% a year, plug those numbers in. It won’t account for rent collected (cash flow), only the property value growth.
Why is the interest portion so low in the first few years?
That is the nature of compounding. In the beginning, you are earning interest only on your principal. In later years, you earn interest on your interest. The Lumpsum Calculator graph will show a “hockey stick” shape—flat at first, steep at the end. That is normal.
What happens if I withdraw interest every year?
Then this calculator does not apply. This tool assumes you reinvest all dividends and interest. If you take the profit out, your principal never grows, and you lose the magic of compounding.
Is there a limit to the amount?
No. Whether you are calculating a $500 micro-investment or a $50 million corporate treasury fund, the math holds up.
A Consultant’s Final Word: It’s Not About the Money
After spending years advising clients, I’ve realized something profound. People don’t use a Lumpsum Calculator because they love numbers. They use it because they love what the numbers represent.
They are calculating freedom. They are calculating security. They are calculating the ability to send a child to a good school or retire without being a burden on their family.
When you see that number on the screen—that “Maturity Amount”—don’t just see digits. See the life it buys you. See the peace of mind it affords. The calculator is just a tool, but the discipline to use it and act on it? That is a superpower.
Don’t let your hard-earned money sit idle because you are afraid of making a mistake. The biggest mistake is doing nothing. Use the inputs, run the scenarios, and deploy your capital with confidence.
If you realize you don’t have a lump sum yet, that’s okay too. Use our Budget Calculator to find room in your spending, or check the Rent vs Buy Calculator to see if unlocking equity in your home is a smart move. The path to wealth is a puzzle, and these calculators are the pieces.
Start today. Your future self is waiting for you to make the right move.
(Internal Tools for further planning: SIP Calculator, GST Calculator, Salary Calculator, Rent vs Buy Calculator, Budget Calculator, Credit Card Calculator)
The Psychology of the Lump Sum: Why We Freeze
We need to address the elephant in the room: fear. When you have a monthly SIP of $500, you don’t stress much about it. It’s a small amount. But when you are staring at a $50,000 check, your brain chemistry changes. This is known as “loss aversion.” Psychologists have proven that the pain of losing $1 is twice as intense as the joy of gaining $1.
When you have a large sum, you become terrified of losing it. This leads to “paralysis by analysis.” You read endless articles, watch news channels, and check the Lumpsum Calculator a hundred times but never actually click “Buy” in your brokerage account.
Breaking the Paralysis
The Lumpsum Calculator is the cure for this paralysis because it quantifies the “Risk of Missing Out.”
If you sit on $50,000 for 5 years because you are scared, and the market does 10%, the calculator shows you lost $30,525 in growth.
Is the risk of the market dropping worse than the guarantee of losing $30,000 in potential growth? Usually, the answer is no. By quantifying the cost of waiting, the calculator pushes you to act.
The “Regret Minimization” Framework
Jeff Bezos famously uses a “Regret Minimization Framework.” When making a decision, he asks, “In X years, will I regret not doing this?”
Use the Lumpsum Calculator to simulate your regret.
- Scenario A: You invest. The market dips 10%. You wait it out. It recovers. You end up with $200k.
- Scenario B: You don’t invest. You keep the cash. Inflation eats 3% a year. In 20 years, your $50k buys only $27k worth of goods.
Which regret is worse? The calculator paints these futures clearly. Scenario B is a guaranteed slow death of your wealth. Scenario A has risks, but it is the only path to victory.
Comparing Investment Vehicles Using the Calculator
A Lumpsum Calculator is asset-agnostic. It doesn’t care if you invest in stocks, gold, or tulip bulbs. It only cares about the rate of return. This makes it the perfect tool to compare different asset classes objectively.
Equity vs. Debt
- Equity (Stocks): historically ~12%. Input this into the calculator.
- Debt (Bonds/FDs): historically ~6%. Input this.
You will see that over 20 years, the Equity result is not just double the Debt result—it is often 3x or 4x. This illustrates the “Risk Premium.” You are getting paid extra for tolerating the volatility of the stock market.
Real Estate vs. Mutual Funds
Real estate is tricky because of leverage (mortgages), but for a pure cash investment comparison:
- Real Estate: Appreciation is usually close to inflation (4-5%).
- Mutual Funds: 10-12%.
Unless you are getting massive rental income, the Lumpsum Calculator often shows that a diversified mutual fund portfolio beats a raw land investment over the long haul simply due to the compounding of liquid returns.
Gold vs. The Market
Gold is a store of value, not a growth asset. It usually matches inflation over centuries.
- Gold: Input 3-4%.
- Market: Input 10%.
The Lumpsum Calculator will quickly show you why the world’s richest people own businesses (stocks), not just vaults of gold. Gold preserves wealth; it rarely multiplies it the way productive assets do.
The Role of “N” in Compounding: A Technical Nudge
We mentioned the formula earlier: $A = P (1 + r/n) ^ {nt}$.
Most simple lumpsum investment return calculator tools assume $n=1$ (compounding once a year).
However, understanding “n” can make you richer.
- Fixed Deposits: Often compound quarterly ($n=4$).
- Savings Accounts: Often compound monthly ($n=12$).
- Stocks: Technically don’t “compound” in a schedule, but they grow continuously.
If you are comparing a corporate bond that pays 8% annually vs. one that pays 7.9% quarterly, you might think the 8% is better. But run the math. - $100k @ 8% (annual) for 10 years = $215,892
- $100k @ 7.9% (quarterly) for 10 years = $218,600
The lower rate actually wins because of the frequency of compounding! While our standard Lumpsum Calculator simplifies this, keeping “frequency” in mind is a pro insight that can squeeze extra dollars out of your deals.
When NOT to Use a Lumpsum Calculator
As powerful as this tool is, it is not a crystal ball. There are times when relying on it blindly is dangerous.
- Short-Term Trading: If you are trading options or looking at a 6-month horizon, this calculator is useless. Volatility dominates short timeframes. The calculator relies on long-term averages.
- Spending Requirements: If you need to withdraw $500 a month from your investment, this calculator won’t work. You need a “Systematic Withdrawal Plan (SWP) Calculator” for that. The Lumpsum Calculator assumes reinvestment.
- Variable Contributions: If you plan to invest $50k now and then add $5k every year, you can’t do it in one shot here. You would need to run the Lumpsum Calculator for the $50k, and a separate SIP-style calculation for the annual additions, then sum them up.
Conclusion: The Map is Not the Territory
We have covered a lot of ground. From the basic inputs to the psychological barriers, from tax drag to asset allocation. The Lumpsum Calculator is your map. It shows you the route from where you are to where you want to be.
But remember: the map is not the territory. The calculator shows a smooth line; your life will have bumps. Markets will crash. Emergencies will happen. You might need to pause.
That doesn’t mean the map is wrong. It means you are the driver. You use the map to re-orient yourself when you get lost. You use the Lumpsum Calculator to remind yourself why you started.
In a world of financial noise—screaming TV pundits, “hot stock” tips from taxi drivers, and endless doom-scrolling—the Lumpsum Calculator is a sanctuary of silence and logic. It doesn’t scream. It just calculates.
It tells you the truth about your money. And in personal finance, the truth is the only thing that sets you free.
Go ahead. Scroll up. Input your number. Dream a little. Then, take action. Your future is waiting to be calculated.
Ready to optimize further?
Check your tax implications with our GST Calculator, or see if you can free up more cash flow with the Rent vs Buy Calculator. Every tool is a step closer to financial mastery.